Rendering OpenStreetMap with Tilemill
Posted by Martin Orr on Tuesday, 20 May 2014 at 19:30
I have decided to play around with creating some maps using the freely available data from OpenStreetMap. I am mainly interested in creating maps of London bus routes but first I had to learn how to use the Tilemill rendering software and how to load OpenStreetMap data into Tilemill. In this post I will describe how I rendered my first map, a very simple line map of London.

What is OpenStreetMap?
OpenStreetMap is a collaboratively edited free online map of the world -- roughly speaking, it is a Wikipedia of maps. You can view the map on the web and also add data to it or correct it when it is wrong or out of date. It is created using data gathered by volunteers, as well as collections of data which governmental or commercial organisations have chosen to allow OpenStreetMap to use.
An important feature of OpenStreetMap is that all of its database is available under the Open Data Commons Open Database License. This means that you can use this data to create your own maps, or other applications, subject only to the attribution, share-alike and keep-it-open requirements of the license. The database contains a lot more data than is visible in the standard web interface, for example, London bus routes which I am going to use later.
What is Tilemill?
Tilemill is a renderer -- a program which takes raw geographical data and draws a map. It is free software developed by Mapbox, available for Linux, Mac OS and Windows. Under the hood, it uses the Mapnik library to do the rendering, which is the most commonly used open source map rendering toolkit. Tilemill gives you a graphical interface to Mapnik, as well as a language called CartoCSS to specify how your map should look, which is said to be easier to use than Mapnik's own language.
Installing Tilemill
A Debian package for Tilemill is being worked on but it is not yet ready, so I installed it from source following the instructions here. This turned out to be straightforward.
Once installed, I could launch Tilemill by running ./index.js.
This displays a list of the example projects that ship with Tilemill.

I created a new project for my first map, unchecking the "Default data" box (the default data puts outlines of the countries of the world in the map, which is very useful when I only want to map London).
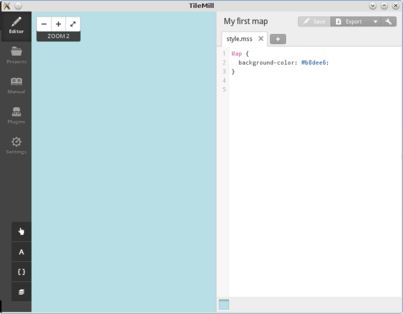
The screen showing the new project is divided into two parts. On the left is a preview of the rendered map, which is currently just a field of blue as I have not yet put any data in it. On the right is the stylesheet for the project, which currently just specifies the background colour.
Getting data from OpenStreetMap
Now it is time to get some data from OpenStreetMap and load it into my Tilemill project. I thought that I would have to set up a PostgreSQL database in order to do this, but it turned out that there is an easier way to get started, namely downloading shapefiles. A shapefile is a collection of geographic data packaged up into three files, and you can download shapefiles for parts of OpenStreetMap from metro.teczno.com.
The metro.teczno.com site offers a choice of osm2pgsql and imposm shapefiles. I don't really know what the difference is so I arbitrarily chose imposm and downloaded the London imposm shapefiles (242 MB).
Unzipping the file gives a number of different shapefiles containing different types of features such as roads, buildings and waterways. I chose to use the roads shapefile (despite the name, it turns out that this file contains both roads and railways).
To load the shapefile in Tilemill, I clicked on the layers icon in the bottom left, then "Add layer".
I gave the layer an ID of london-roads, and in the Datasources field I chose the london.osm-roads.shp file I had just unzipped.
Then I clicked "Save & Style" -- the "& Style" bit means that Tilemill will add a default rule for the new layer to your stylesheet, so that the layer appears in the rendered map.

For now all we see is a small dark blue splodge in the preview because we are zoomed out too far. Clicking the magnifying glass icon in the layers box zooms to fit the layer we just added.

At this zoom level all I can really recognise is the Thames estuary, but zoom in three or four more times and we get something which is recognisably a map of London as a monochrome line drawing.
Finding where I live took a little work because I am not used to such a bare map, but the railways make obvious reference points and I soon located it.
Exporting a map
To export the map, I clicked "Export" in the top right and chose "PNG". Then I had to zoom in until I could select the area I wanted. This is a bit tedious, and Tilemill does not remember the area you choose, so I copied the coordinates in order to be able to reuse them next time.

It took a few seconds to render the image, then I could save it. This is the map you can see at the top of this page.
When this was done, I used the wrench icon in the top right to access the project settings. Here I could paste the coordinates I had copied above into the "Bounds" field, so that in future it will export that area by default. When doing this I also had to alter the "Center" to a point inside this area -- this is the point where the map preview starts when you open the project.
Copyright notice
The maps in this post are created from data which is © OpenStreetMap contributors, licensed under the Open Data Commons Open Database License.
The text of the post was written by Martin Orr. He has waived all copyright and related rights to this text, to the extent permitted by law, by applying the Creative Commons CC0 1.0 Universal Public Domain Dedication.